A Study Of Kickstart Campaign Data
Recently, some Kickstarter campaigns have been brought to my attention via the Your Kickstarter Sucks Podcast. I have been blown away by the sheer volume of bizarre and unnecessary Kickstarter campaigns that people sink valuable time and money into developing. Some of my favorites include the Smart Spinner: The Most Unique and Versatile Fidget Spinner, The Guac-e Talk-e, and the classic Mokase. I am setting out to analyze several features of Kickstarter campaigns, and create a prediction model to determine if the campaign will be a success or not. I hope to offer a way for Kickstarter campaign managers to see if their idea is worth launching on the platform.
Data Wrangling and Cleaning
I got my data from webrobots.io who have been scraping Kickstarter data since 2015. The data set was almost 50 GB of csv files, making analysis on the entire set unmanageable, so I selected a smaller set to make generalizations on the set as a whole. I also just included projects from the United States, to ensure that I can create a viable model without the confusion of comparing projects from different countries.
Data Exploration
The first thing I wanted to look at was the project categories. Which categories were the most popular? Which categories had the highest success rate?
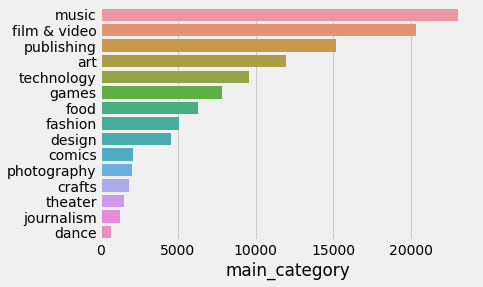
This shows the most popular categories across the platform.
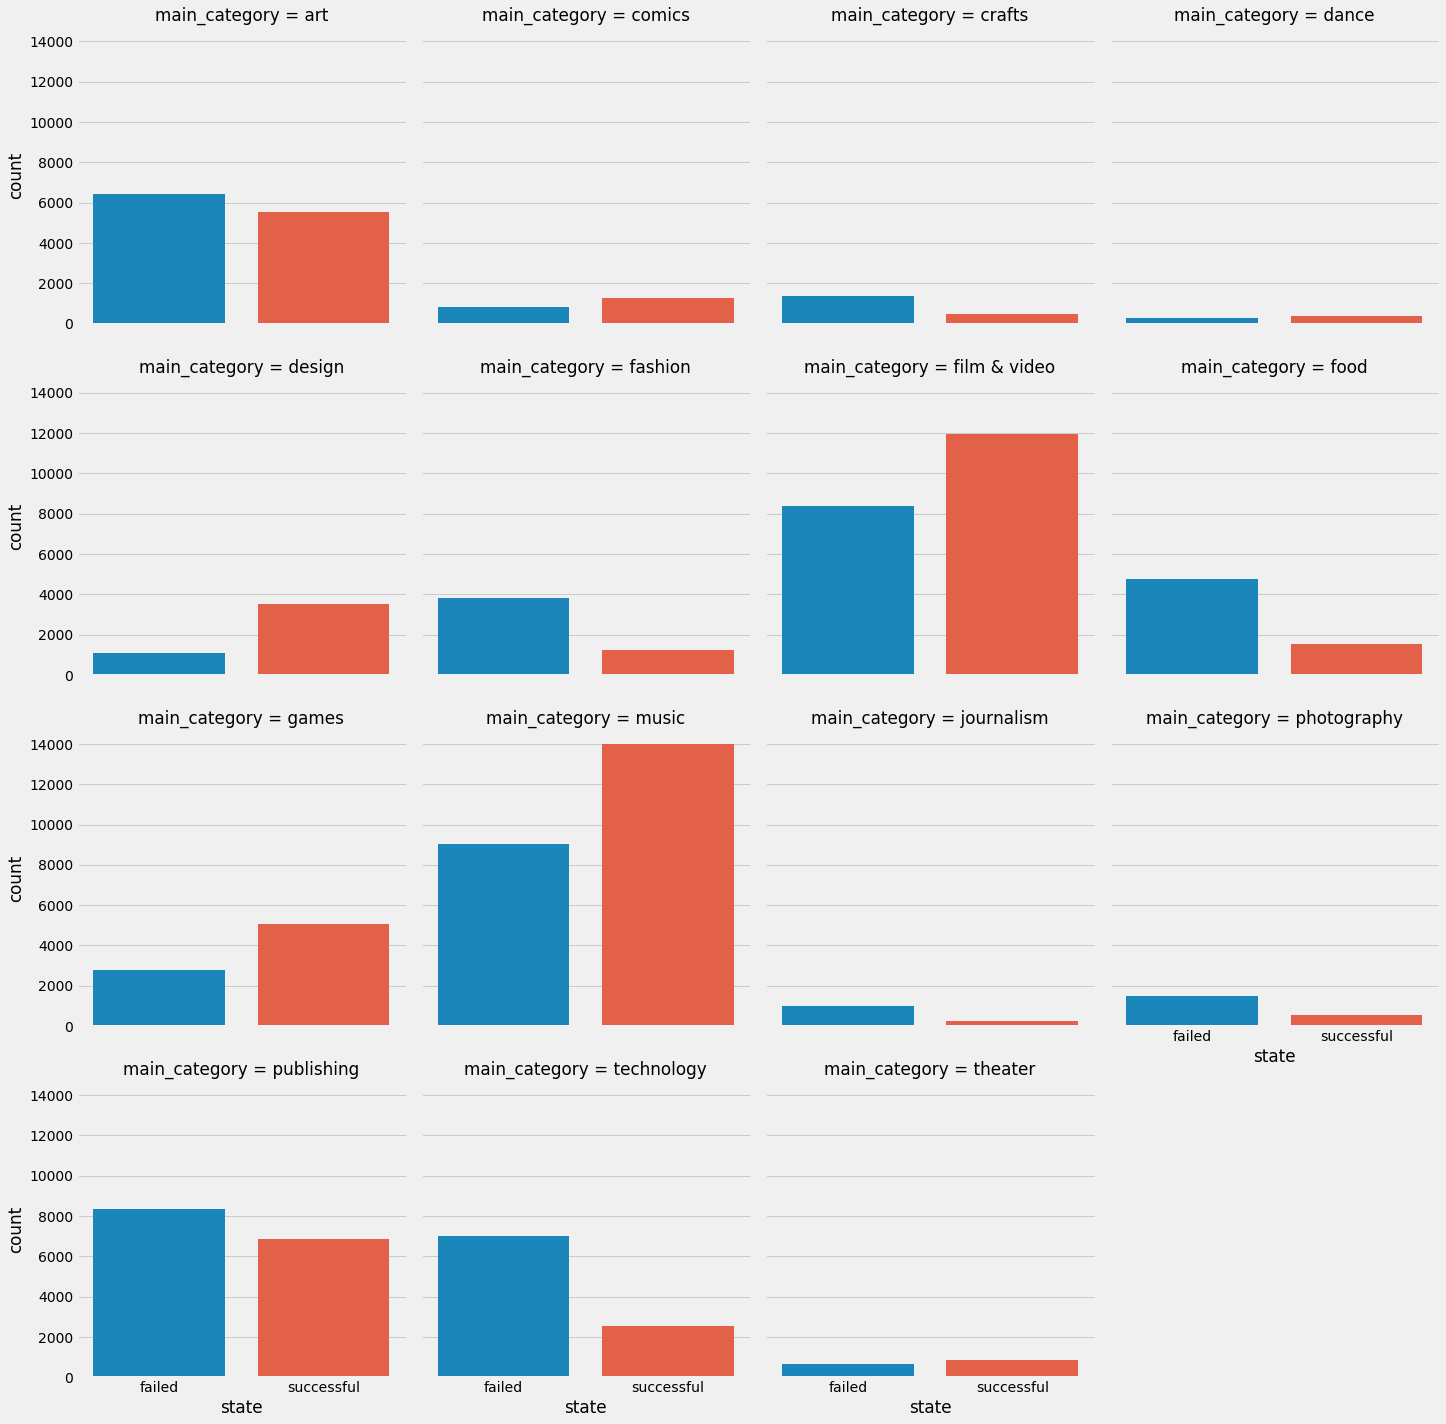
In red is the number of successful campaigns, in blue are failed. Film and Video, Music, Games, Comics, Dance, Theater, and Design all have more successful campaigns than not. This is somewhat surprising that the
This shows a breakdown of categories by success. There are clearly some categories that are more likely to succeed than others.
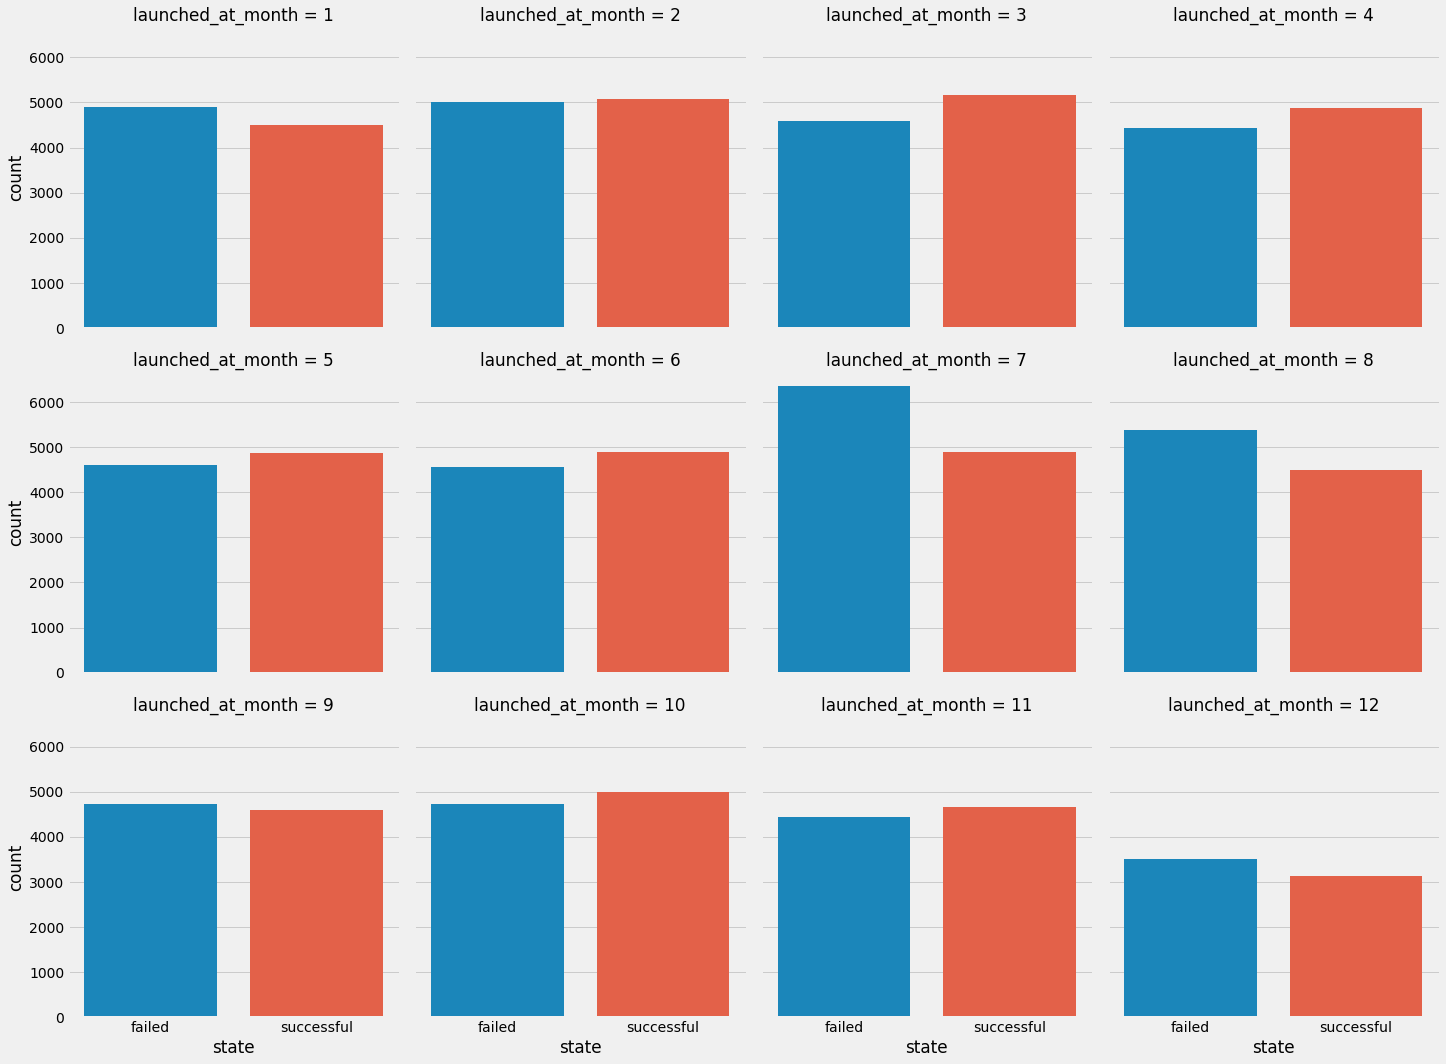
I also wanted to see if there was a particular month that had more successful campaigns. March, April, June, October, and November all had more successful than failed campaigns, so timing also might be a significant factor in the success of a particular project.
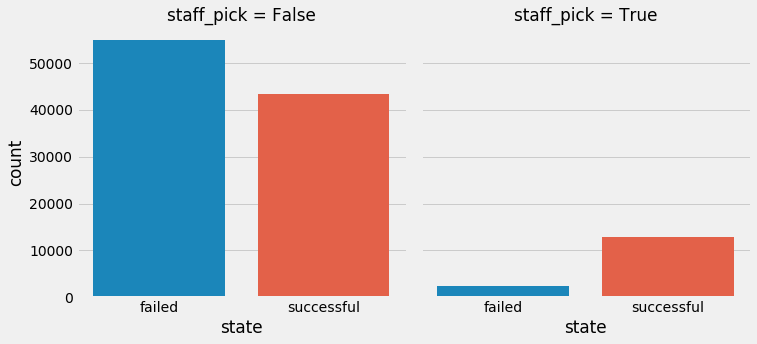
A final element of interest is the staff pick, which is simply an endorsement from a staff member of Kickstarter. This often leads to more exposure for a particular product. As you can see, the endorsement of a project often leads to a successful campaign.
With all of these features in mind, we can start using them to start creating models for predicting if a Kickstarter campaign will be successful or not.
Model Fitting
I will use a variety of different methods to try to create a good model for prediction.
Numeric Values
Logistic Regression (Logit)
Logistic Regression is useful because it creates coefficients for each feature, meaning I can see which feature effects the model, on the whole, more clearly.
Random Forest
I will use a random forest classifier as an alternative to Logistic Regression. Perhaps the random forest can expose trends that Logistic regression missed.
Text Values
Bayesian Classifier
We will use a Bayesian classifier to look for common features among descriptions of the campaigns to see if text features indicate the success of a campaign. Bayesian Classifiers are often used for natural language processing problems like this because they are simple and offer good results.
Random Forest
I will also be using the random forest to see if any other patterns emerge from the text values that were not apparent in the bayesian classifier
Ensemble Method
I will try to incorporate both types of text and numeric values together to find if they work better together.
Measuring Success
I will use the AUROC or AUC for short, score to measure how well my model can identify successful and failed Kickstarter campaigns. This is a way to measure true positive rates (successful campaign), against false positive rates (identifying a failed campaign as successful) The closer the AUC is to 1, the better it is. For more information on AUC curves, check [here] (https://en.wikipedia.org/wiki/Receiver_operating_characteristic)
Our sample data has about a 50/50 split of successful and failed campaigns, so our baseline AUC score is 0.5. I will look to simply improve on that measurement.
Logistic Regression
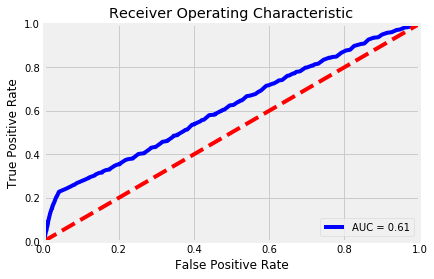
After running the logistic regression out of the box, I got an AUC score of .61. Since this score is only .10 above the null value we are looking for, we will tune our parameters to fit the logistic classifier better.
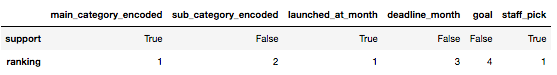
I also was interested in the importance of the fields in the classification model. Using a RFE classifier allowed me to expose the most influential fields.
Tuning Parameters
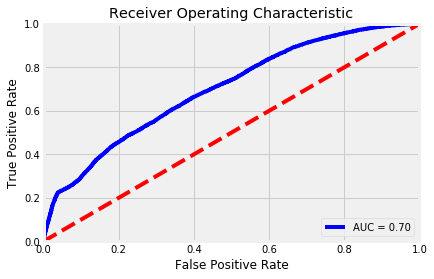
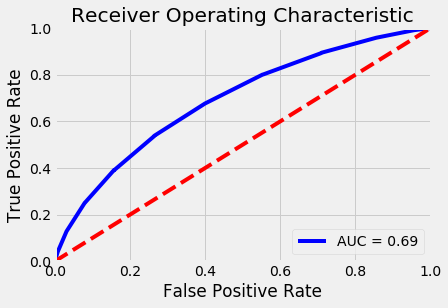
I used a Grid Search to search for C, a parameter that helps regularize the fit of the regression. After tuning, the AUC score was brought up to .70, which is a pretty good increase from the null AUC. However the accuracy is only 63.16 percent, so I will try to use a different classifier to get a more accurate model.
Random Forest Classifier
The random forest classifier can find harder to find patterns in our data through its randomness.
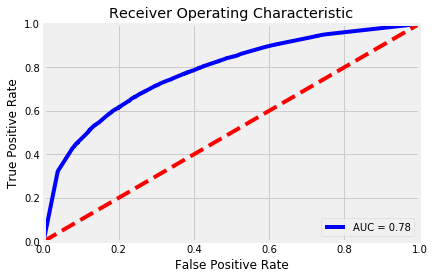
Out of the box, the AUC of the random forest is higher than the Logistic Regression classifier. However, this model had some overfitting problems. The accuracy on the training data is 89.57 percent while the accuracy on the test data is 70.98. Meaning it was too good at classifying the training data set, but had a difficult time making generalizations about the test data set it had never seen. I need to tune the parameters to make a better fitting classifier.
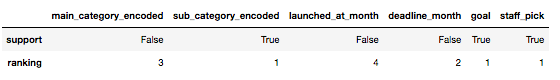
Using the RFE classifier again, I wanted to see the most important fields in the random forest classifier. The most important fields were the exact opposite of the logistic classifier. This makes sense because the random forest randomly decides which field to make decisions on, making the most important fields pretty much random.
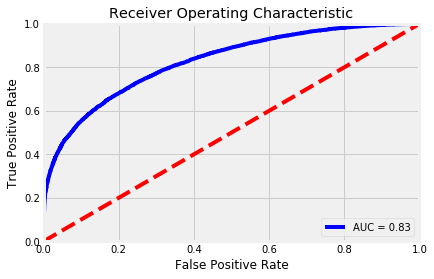
After tuning parameters like max depth and number of trees generated, I had greatly reduced overfitting while improving accuracy to 74.08 percent and got an AUC score of .83. This is a pretty good improvement from where we started.
Natural Language Processing
I will be using the description of the Kickstarter project to see if there are useful attributes in predicting the success of a campaign. I will use a CountVectorizer, to create a way for classifiers to interpret the text data.
Count Vectorizer
I will use a count vectorizer to convert the descriptions of the projects into a sparse matrix for me to conduct analysis on. I will be using a “bag of words” technique where I don’t care about the order of words, just frequency and relationship to descriptions of other projects. I will have to do a little bit of tuning on the Count Vectorizer to get the most accurate results I can. The Count Vectorizer creates a dictionary underneath the sparse matrix that keeps track of the words that are in all the descriptions. Keeping only words that appear a certain amount of descriptions decreases noise in the analysis. Also grouping words together in pairs as one dictionary entry helps identify important phrases, adding a little more sophistication to our “bag of words” technique.
Naive Bayes
This classifier is often paired with natural language processing and provides accurate results for this type of classification problem.
Out of the box, our classifier performs decently. It is overfitting the training data more than I would like, so I make it better through parameter tuning for both the Count Vectorizer and the Bayes classifier.
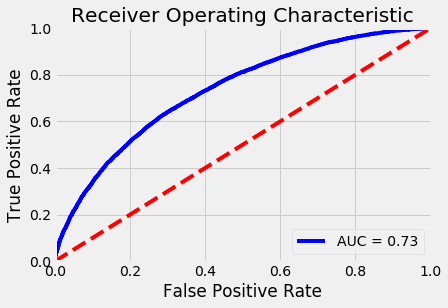
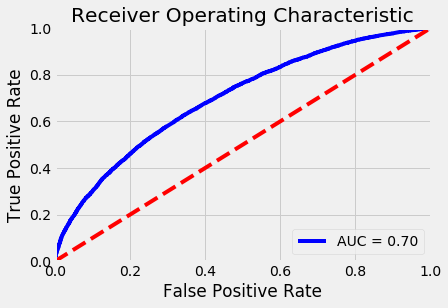
After tuning, the classifier is not overfitting at all, which is great! However, our AUC is still not that great. At only .73, maybe we should try a different classifier to get better results.
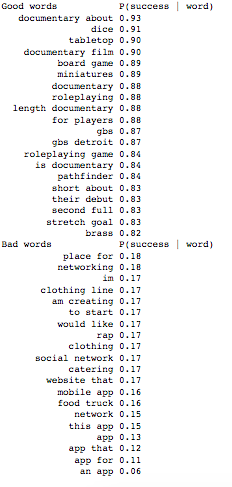
We also were able to pull out the words that implied the most successful campaigns as well as the ones that implied a failed campaign.
Random Forest
We will use random forest again to see if it yields more success!
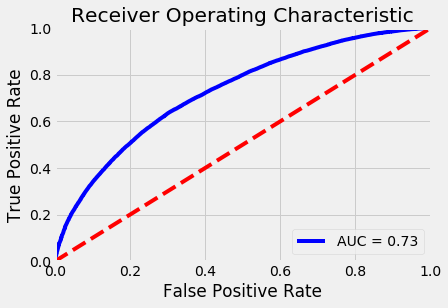
Using the same vectorized words, got a decent AUC score, but we got significant overfitting. The accuracy on the training data was 98.21 percent, and test data was only 63.75 percent. We need to tune our parameters!
After finding the best parameters, our accuracy for test and train came a lot closer to each other and slightly increased our test data accuracy to 64.13 percent. This is only 15 percent better than randomly choosing, so I think I will stick with the Naive Bayes classifier for the descriptions.
Voting Classifier
Since I want to use both the numeric and text data to try to predict if a Kickstarter campaign will be successful or not, I will use a voting classifier to blend the two methods together. ‘Soft’ voting means that the average prediction between the two models will be counted as the prediction for the entire classifier.
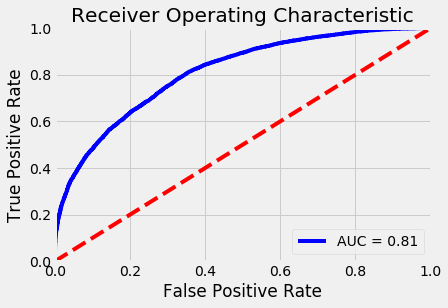
Conclusion
Through creating these classifiers, we have achieved a combined score of .81. This is a pretty significant improvement from where we started, but generally still not super accurate. Since the features I was working with have no intrinsic measure about how good a particular project will do in fundraising, the model had to generalize pretty significantly about the attributes. For a larger improvement, more features would be needed to make a better estimate.