As a fan of Liverpool Football Club, a Premier League football team that narrowly came in second place in the 2018-19 season, I wanted to see there was a way to predict how many points a team would earn throughout a season. I will be looking at squad worth, average attendance of home game, manager history, performance throughout the last season, as well as other important attributes of a team. Using this information, I hope to get accurate predictions for how well a team will do in a premier league season.
Collecting Data
This data was wildly available online for me to use, however, it was difficult to find any in csv, api or more manageable form. I had to scrape the information from transfermarkt.com to get what I needed. This process was difficult for a variety of reasons. First, the website was created in Germany, meaning all of the tags and notes inside of the webpage were all in German. This made understanding of what was going on a little more difficult. Next, the website did not follow the tightest html standards, and this caused me difficulties in several situations. Finally, since Germany uses commas to delimit decimals and periods to show value in large numbers, it took some time to reformat this data to be used appropriately.
A discussion of the process can be found here.
Exploratory Data Analysis
Once I had put together the data, I wanted to look at some key statistics. I had information from the last 14 premier league seasons since that was the first year transfermarkt started publishing player values.
Total Points Per Club
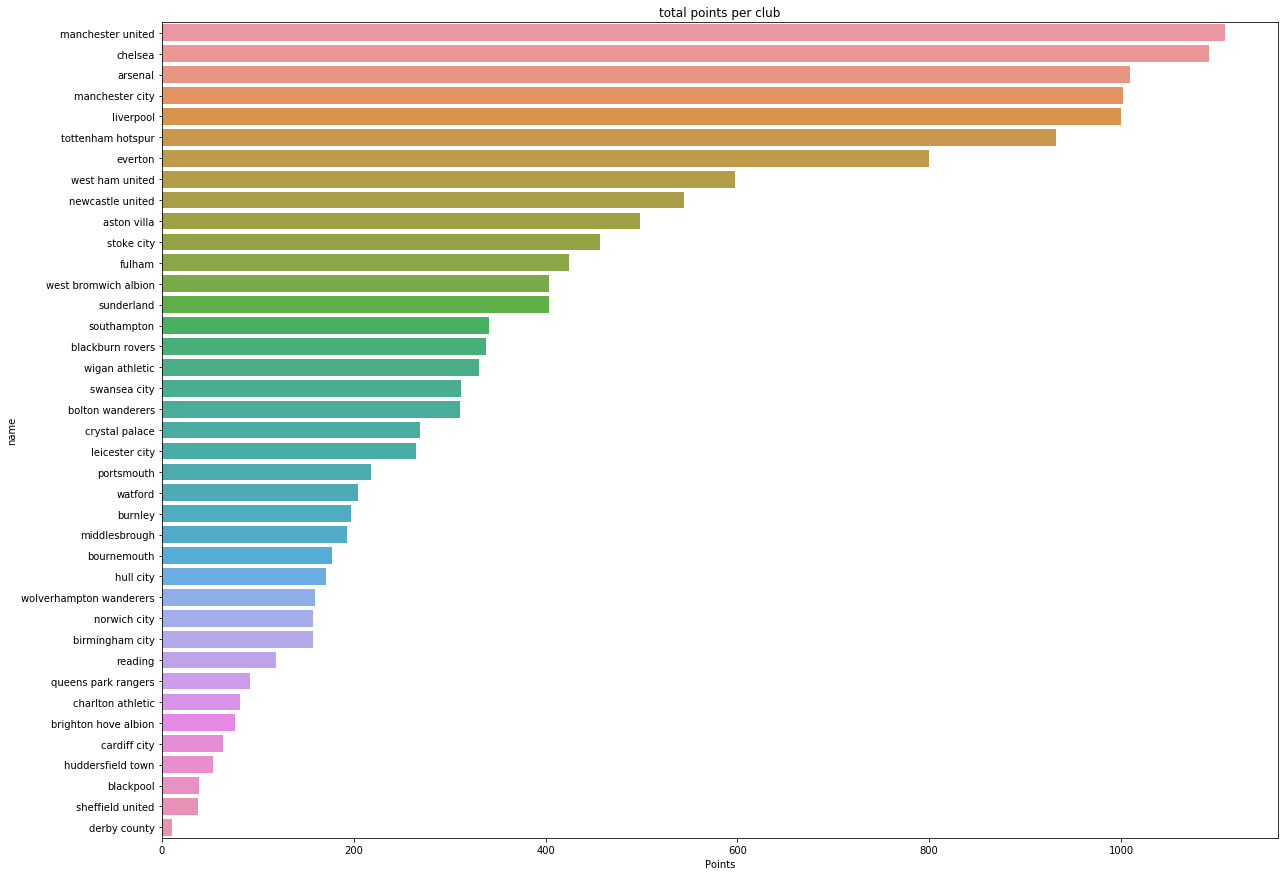
You can see the classic “Top 6”, a term of the perennial top 6 finishing teams. This group is composed of Liverpool, Arsenal, Manchester United, Manchester City, Chelsea, and Tottenham. These six teams are the highest performing teams, and have not been relegated in the period I was looking at. Everton is another team that has not been relegated in this time frame, but does not have the same reputation as the “Top 6.”
Money Spent on Players Per Club
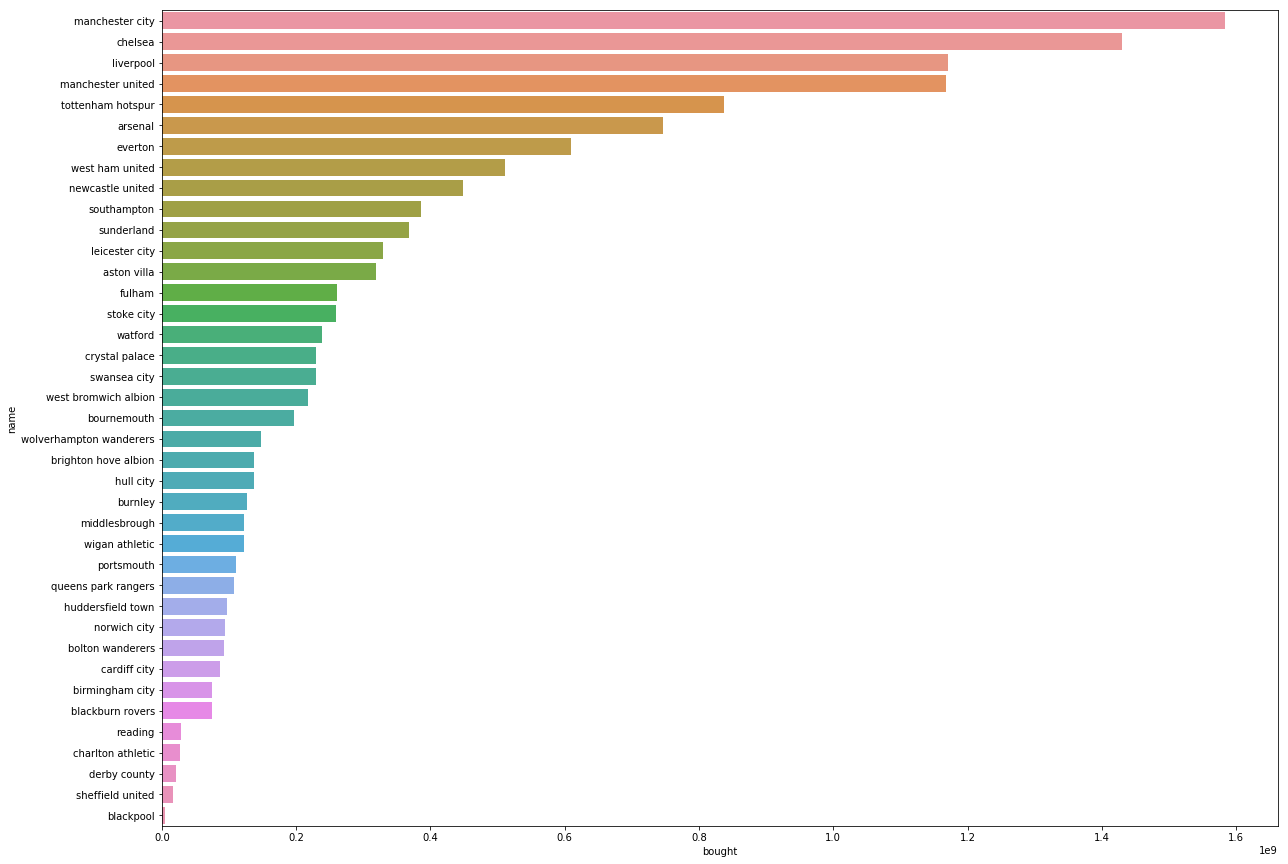
I also wanted to see the highest spending clubs during this time frame. I would assume that the clubs that spent the most on players, would have the best team meaning that they would earn the most points throughout a season. This theory fits with this visualization because the total number of points is similar to top spending clubs.
Let’s take a closer look at this relationship
Bought, Sold and Net
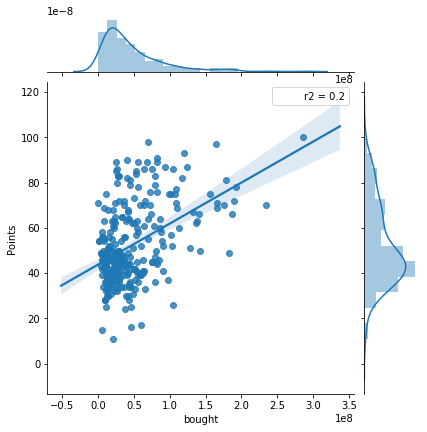
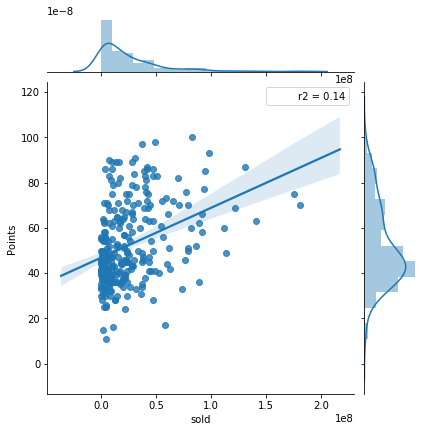
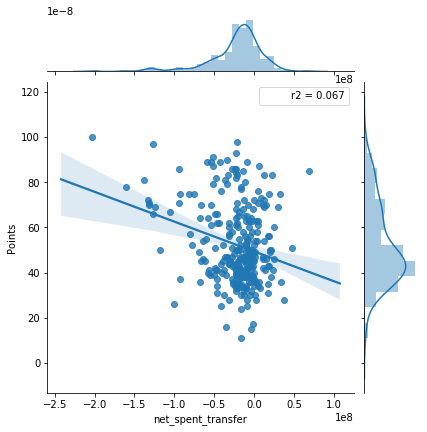
Looking at the comparison between players bought and points, there seems to be little correlation. Same with players sold and points. Thinking about it, it seems as though high spending teams would be earning more points, but that is not as significant as I thought. The same is true with players sold, if you sell your best players, you probably are going to be worse! The net transfer spent shows the difference between sold and bought, meaning if a team is in the positive, they sold more than they bought. There seems to be almost no correlation between these and point values.
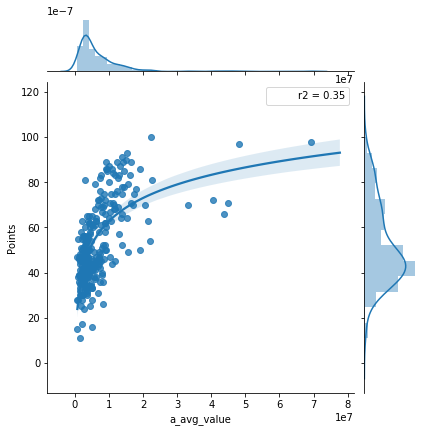
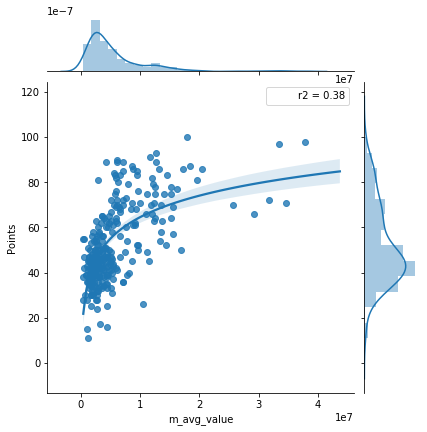
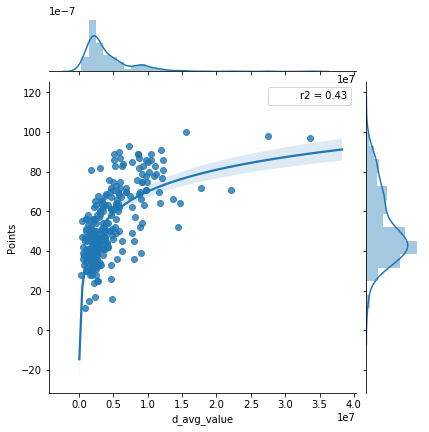
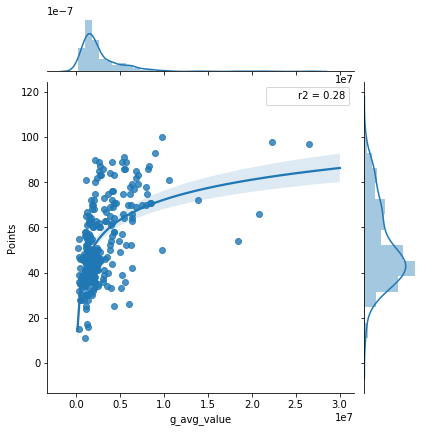
Player Value vs Points
Attacker Average Value
Midfielder Average Value
Defender Average Value
Goalkeeper Average Value
Total Average Value
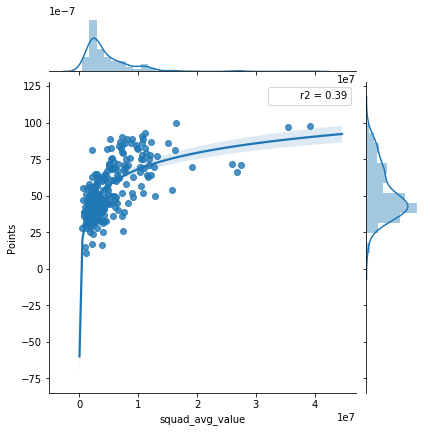
The next thing I wanted to look at was the average squad value compared to points earned. There still doesn’t seem like a particularly close relationship between the two sets of values.
Model Fitting
After exploring the data, I can see that there are some relationships between transfer activity, squad value, and points, but nothing extremely strong. I will try to fit a model to this data as well as I can, but there might be some additional data that would be more helpful.
Random Forest Regressor
After parameter tuning and preprocessing our data for scaling, we got an R^2 of 0.707 and a Root Mean Squared Error of 9.85. This R^2 value is not bad, and our RMSE is 10 points off from where we would expect. We should try to tighten our analysis to try to get our RMSE as low as possible.
Bayes Ridge Regression
I parameter tuned and preprocessed the data for Bayes Ridge Regression, and ultimately got pretty similar results as Random Forest. We got a R^2 of 0.680 and a Root Mean Squared Error of 10.30. We were not able to improve the modeling with a different algorithm, so maybe its time to reflect on if we had sufficient data.
Conclusion
Given the limited scope of my analysis, I think the results of the model are not bad! The model has a mse of 9.85 which indicates an average of 9.85 points off the actual point total. I will look to build on my data set, including manager history, club ownership, and as much additional information I can get. This is just the first step in a larger project, so look for updates!